Monitor the migration progress
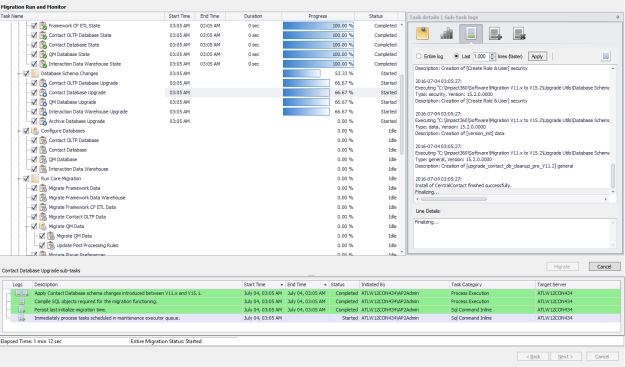
The Migration Run and Monitor page displays a real-time progress of each task and its sub-tasks.
You can select a task from the left pane (A) to display its sub-tasks on the bottom pane (B) and drill-down to view more information and logs on the right pane (C).
A. Left pane: Tasks progress details
|
Column title |
Description |
|---|---|
|
Start Time |
Start time of the task. |
|
End Time |
End time of the task. |
|
Duration |
Total time the tsk run. |
|
Progress |
Percentage of the task. |
|
Status |
Task status (also indicated by an icon next to the task):
|
 Idle (task is not yet run)
 Started
 Completed
 Canceled
 Failed
B. Bottom pane: Sub-tasks details
|
Column title |
Description |
|---|---|
|
Logs |
Linkable icons indicating the type of log created for the sub-task:
|
|
Start Time |
Start time of the sub-task. |
|
End Time |
End time of the sub-task. |
|
Status |
Sub-task status:
|
|
Initiated By |
The user account who runs the sub-task. |
|
Task Category |
Sub-task category such as SQL script, SQL Command Inline, Process Execution, and PowerShell Execution. |
|
Target Server |
Server host name that runs the sub-task. |
 Activation log
 Progress log
 Activation Failure log
C. Right pane: Task details and sub-task logs
|
Button |
Description |
|---|---|
|
|
Displays a description of a selected task. |
|
|
This icon is only available for tasks related to database tables. It displays the progress of each table and index of each the database. Note: The progress bar displays the percentage according to the estimated amount of data. It is possible that the task is completed before showing 100% completeness. |
|
|
Displays a real time log about the activation of the sub-task. |
|
|
Displays a real time log about the progress of the sub-task. |
|
|
Displays a real time log about activation failures of the sub-task. |


D. Migration status bar
Displays the following details about the entire migration progress:
-
Elapsed time.
-
Entire Migration Status (Running, Completed, Canceled, or Failed).
Procedure
-
To display the sub-tasks of a task, select a task from the left pane.
-
To display a log of a sub-task, select a sub-task from the bottom pane, and click the relevant log button (Activation, Progress, or Activation Failures).
-
To display a specified number of lines of the log on the right pane:
-
Select Last # lines.
-
Set the required number of lines to display.
-
Click Apply.
-
-
To display the entire log on the right pane:
-
Select Entire log (was Fetch a whole file).
-
Click Apply.
-
-
To pause the log progress, click
 . To resume, click the button again.
 -
To download a log, right-click the log on the right pane and click Save.
-
Wait until the data migration completes successfully.
Once completed, a relevant message is displayed.
-
Click Next.
The Data Migration Completed page appears.
-
Click Finish.
Interactions databases migration time
What to do next
If ‘Rebuild all table indexes as part of data migration process’ option was selected and the data migration and indexing processes are completed successfully, the migration procedure ends here (no need to finalize the migration). Otherwise, check the Data Migration Monitor and verify that the indexing process is completed and then continue to Finalize the migration.
You can open the Data Migration Monitor directly from the notification area, right-click the System Tools and select Run > Data Migration Monitor V15.1 to V15.2.