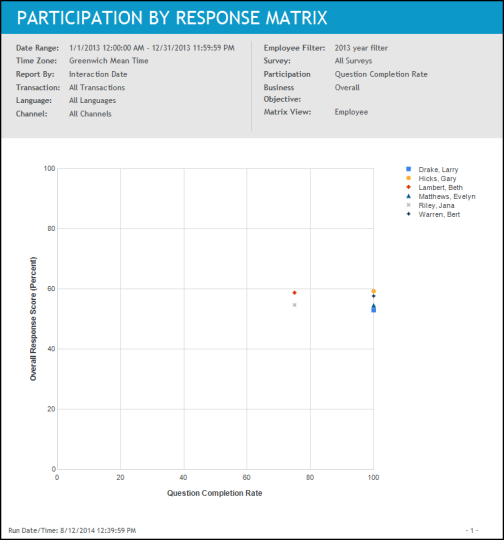
Participation by Response Matrix report
Analyze the output from this report to spot anomalies in agent-level participation in the Voice of the Customer practice and results. If an agent invites feedback only when a call goes well, the agent’s survey scores will be high but the survey participation rates will be low.
The Participation by Response Matrix report report generates a scatter chart. The matrix view enables you to correlate a participation metric with response scores for a single business objective or all business objectives.
The matrix view can be organization-based or employee-based.
-
For an organization-based matrix, the points plotted represent direct suborganizations only.
-
For an employee-based matrix, the points plotted represent all employees for all organizations subordinate to the selected organization.
-
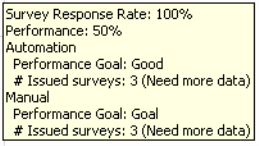
If you selected a specific business objective that has a feedback goal defined, it is displayed above the matrix chart.
Report output/data
The Participation by Response Matrix report contains the following data relative to the selected report parameters:
|
Data |
Description |
|---|---|
|
X-axis |
Plots one of the following participation metrics you selected in the report parameters:
|
|
Y-axis |
Depending on your report parameter selections, plots one of the following average scores:
The Y-axis is scaled to a percentage-basis. |
|
Scatter Points |
Data points will be plotted relative to the X- and Y-axes and represent either direct suborganizations or employees, depending on how you selected your parameters when running the report. A point’s location on the matrix corresponds directly to its values on the X- and Y-axes. Mouse over a data point to see detailed information about the data point, such as:
|
When data points occupy the same position on the matrix
If entities occupy the same X/Y position on the matrix, the ToolTip provided when you mouse over the data point will include each entity. The ToolTip text will display the entities in descending order by volume of data.
If drill through functionality is provided, the entity with the highest volume of data will be reported.
Drill through report options
You can drill through to other reports and see additional information.
|
Report Link |
Drill Through Report |
|---|---|
|
scatter points |
|