Performance Trend chart
Use the Performance Trend chart in the Performance Overview workspace to view multi-KPI performance data as a set of colored line graphs indicating scoring trends over the defined time period.
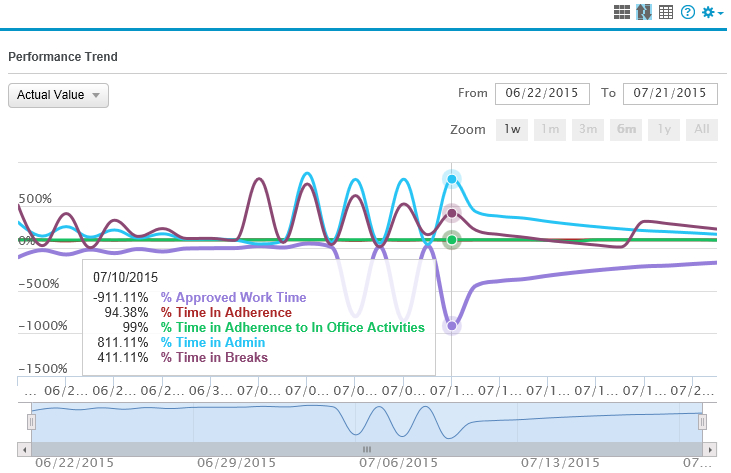
Performance Trend date controls