Team Aggregate Multi KPI
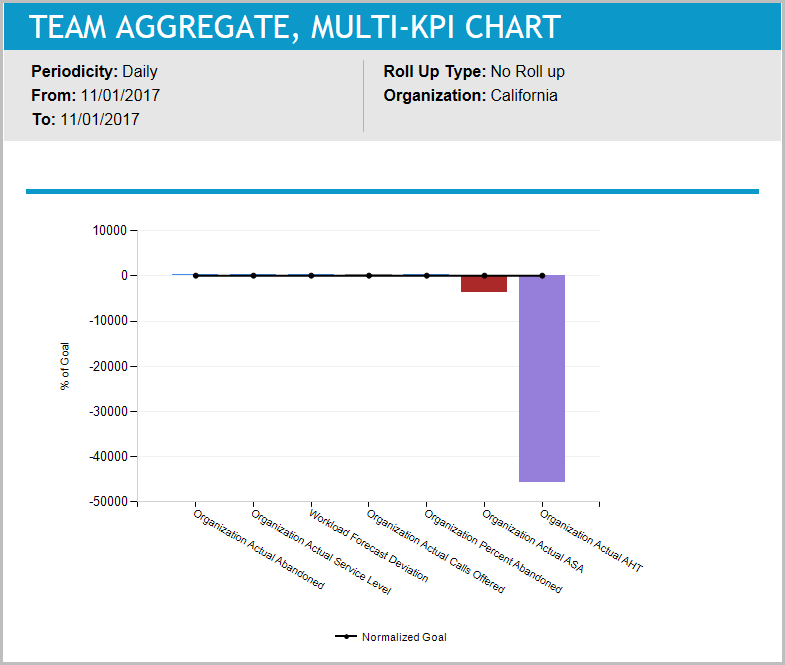
This report displays all KPIs for an organization’s Scorecard, represented as bar charts, each bar having its own scale, normalized so that the goals are at the same x-coordinate. The Goal for each KPI is indicated as 100.

Default Access Rights
This report can be run by the following roles: Administrator, Branch Administrator, Branch Manager, Manager, Scheduler, Supervisor.
Inputs
-
Organization: Allows you to select the desired organization by means of the pop-up selector.
-
Period: Allows you to specify the date for the data you want retrieved. Dates can be specified in one of two ways:
-
Last completed <periodicity>
where:
<periodicity> is one of Day, Week, Month, Quarter, or Year
-
<periodicity> <start_date> <end_date>
where:
<periodicity> is selected through a drop-down menu, and can be one of Daily, Weekly, Monthly, Quarterly, or Annually.
<period> allows you to select the period for that periodicity using a date selector.
You select the start date of the period; the end date of the period is automatically filled in by the system.
-
Outputs
-
From: The starting date of the period being displayed.
-
To: The ending date of the period being displayed.
-
Organization: The organization for whom scores are displayed.
-
Periodicity: The periodicity of the KPI values being displayed.
-
Bar charts, each bar having its own scale, normalized so that the goals are at the same x-coordinate. The Goal for each KPI is indicated as 100.