Trend line
In List View for both category and term trends, the trend line provides a snapshot of the trend. You can view the trend line in detail in the Trend View.
Trend line for recent changes
When the trend analysis is set to Recent Changes, a red dotted line appears on the trend line. This line shows the comparison between 3-4 weeks before the specified date, and the specified date.
The line graph to the left of the line displays the average of the trend for the past 3–4 weeks. The line graph to the right of the line displays the average of the trend for the specified date.
![]()
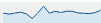
Trend line for long-term volatility
When the trend analysis is set to Long-term volatility, a red dotted line does not appear on the trend line. The Long-term volatility method does not compare different time periods.
Rather, the trend line shows the snapshot of the trend (including its ramps and humps) for the defined time period.