Trend view description
The Trend View shows a close-up view of trends during a specific time period.
View details of a single trend
When you select to view a single trend, you can view details about that trend during a specific time period.
|
No. |
Description |
|---|---|
|
1 |
Displays the select the date range by which to view trend data. |
|
2 |
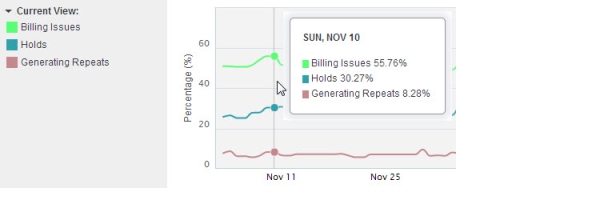
Displays the average percentage of interactions for the category or term on a specific date by pointing to the line representing that date. |
|
3 |
With the range slider ( The closer the sliders, the shorter the time periods displayed on the graph. The farther away the sliders are from each other, the longer the time periods displayed on the graph. |
|
4 |
Select the daily volume (or total daily number) of interactions for a data source. After you select a data source, the graph displays the total number of interactions per day as gray bars. This view helps you compare the average percentage of interactions for the category or term, against the percentage of total interactions for the specified day. To remove the gray bars, select <None> in the Daily Volume menu. NOTE: Daily volume data is displayed for one project only at a time. Even if All Projects is selected, the daily volume only represents data for the name of the project indicated by the Project field. |
|
5 |
Each bar represents the total number of interactions per day (only appears if Daily Volume bar is selected). |
|
6 |
You can use these buttons to select time periods over which to view data. The options include:
|
Compare multiple trends
The Trend View displays line charts for each selected trend, differentiated by color: