Answer Distribution report
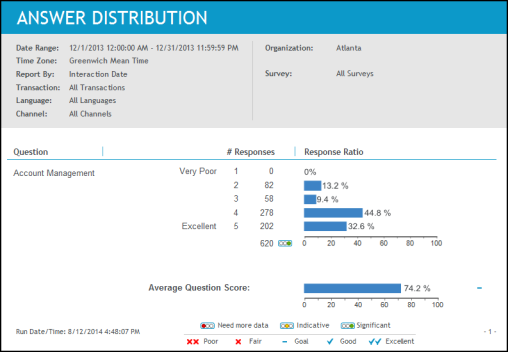
For a single question, Answer Distribution report shows the frequency for each response over a specified time period. You can use it to understand the data behind a rolled-up response score.
For example, this report would show whether a score is comprised of mostly similar responses or mostly very good responses with a few very bad responses.
Report output/data
The Answer Distribution report contains the following data relative to the selected report parameters:
|
Data |
Description |
|---|---|
|
Question |
Name of the question. |
|
# Responses |
|
|
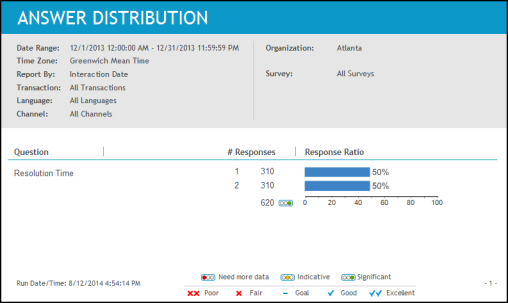
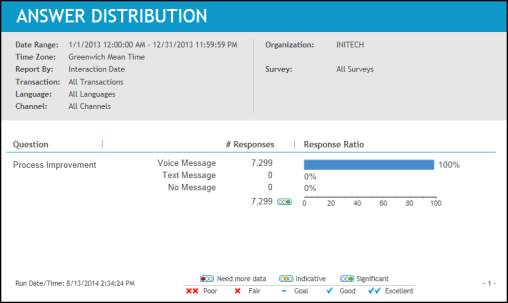
Response Ratio |
Ratio of this response compared to the other responses expressed with a bar chart and as a percentage. (This section of the report is not applicable to Comment questions.) When goals have been configured, a goal indicator is displayed. |
Drill through report options
You can drill through to other reports and see additional information.
|
Report Link |
Drill Through Report |
|---|---|
|
Response ratio (bar chart) |
Feedback Sessions report |