Response By Question report
This Response By Question report enables you to compare responses across various questions either by business objective or survey. You can choose a specific business objective or all, or a specific survey or all.
You can, for example, view all questions in a business objective to see questions from different surveys on a common topic (Agent Skills, Product Quality, Brand, and so on) and understand specific drivers of satisfaction within that objective.
Additional data available with Speech Analytics integration
When the Survey report parameter is selected and Speech Analytics assigns a speech category to a Comment question response or a survey closing comment, the speech category and related information are included in this report.
Report Output/Data
The Response By Question report contains the following data relative to the selected report parameters:
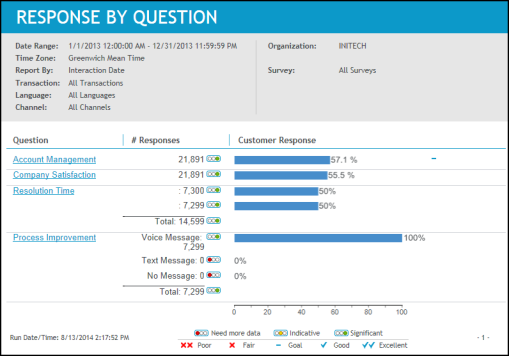
|
Data |
Description |
|---|---|
|
Question section: |
|
|
Question |
Name of the question. |
|
# Responses |
The data varies based on the question type:
|
|
Customer Response |
The data varies based on the question type:
Scale and option questions: When goals have been configured, a goal indicator is displayed. |
|
Voice Message subtable: When Customer Feedback is integrated with Speech Analytics and the Survey report parameter is selected, a subtable will be under Voice Message when Comment question responses are assigned to one or more Speech Categories. This subtable includes the following three columns: Speech Categories, Percent in Category, and Ave. Score. |
|
|
Speech Categories |
Name of a Speech Analytics category and the number of responses assigned to it. Speech Analytics assigns a response to a category when it meets the category definition (properties and terms). |
|
Percent in Category |
For each speech category, the bar graph represents the ratio of responses in this assigned category to the total number of voice responses. The sum of the Speech Categories can be more than 100% because each comment response can apply to more than one category. |
|
Ave. Score |
Average score of all responses assigned to a Speech Analytics category. |
|
Survey section: When the Survey report parameter is selected, this report includes a Survey section. |
|
|
Survey |
The label Closing Comment is displayed. |
|
# Responses |
Total response count for each possible survey closing comment (Text Message, Voice Message, and No Message) and a total number of responses for all possible responses. The No Message count represents the total number of surveys without a closing comment. All surveys are included regardless of whether or not the survey was set up to invite the customer to leave a closing comment. |
|
Customer Response |
Response ratio for each possible survey closing comment expressed as a percentage (Text Message, Voice Message, and No Message). The No Message percentage represents the total number of surveys without a closing comment. All surveys are included regardless of whether or not the survey was set up to invite the customer to leave a closing comment. When goals have been configured, a goal indicator is displayed. |
|
Voice Message subtable: When Customer Feedback is integrated with Speech Analytics and the Survey report parameter is selected, a subtable will be displayed under Voice Message when a survey closing comment is assigned to one or more Speech Categories. This subtable includes the following three columns: Speech Categories, Percent in Category, and Ave. Score. |
|
|
Speech Categories |
Name of a Speech Analytics category and the number of closing comments assigned to it. Speech Analytics assigns a comment question response to a category when it meets the category definition (properties and terms). |
|
Percent in Category |
For each speech category, the bar graph represents the ratio of closing comments in this assigned category to the total number of voice responses. The sum of the Speech Categories can be more than 100% because each closing comment can apply to more than one category. |
|
Ave. Score |
Average score of all closing comments assigned to a Speech Analytics category. |
Drill through report options
You can drill through to other reports and see additional information.
|
Report Section |
Report Link |
Drill Through Report |
|---|---|---|
|
Question |
Question text |
Answer Distribution report |
|
Customer Response (bar chart) |
Participation Trend report |
Sample report
Define categories (Speech Analytics User Guide)
Define terms for the category (Speech Analytics User Guide)
Ranking and relevancy (Speech Analytics User Guide)