Participation Trend report
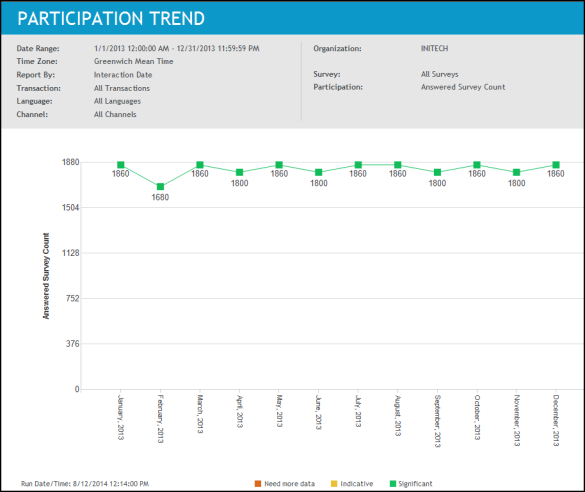
Use the Participation Trend report to generate a line chart that illustrates the average survey participation for an organization or an employee over a given period of time. You select both the time frame and the participation metric for trending.
Any participation report indicates the health of your Voice of the Customer practice, not the results provided by customers. You can see if customers are participating in surveys and the extent of that participation.
Participation reports enable you to use response rates to identify
-
the level of customer participation in surveys,
-
the completion rate when customers start a survey, and
-
if the customer experience (the timing and language of the offer to share feedback) is conducive to participation.
-
if the survey design is effective in terms of asking the right questions and the branching logic used (if any)
For example, a low completion rate could indicate that a survey is poorly structured or not relevant to the caller’s experience. A low participation rate may indicate that the way you bring customers into a survey is not effective.
In addition to performance values reported as a percentage, you will also see an indicator of the volume of data collected. The volume of data suggests the significance of the percentages reported.
Report output
The Participation Trend report contains the following data relative to the selected report parameters:
|
Data |
Description |
|---|---|
|
X-axis |
Plots the specific time frame (days, weeks, or months) you have selected in the report parameters. |
|
Y-axis |
Depending on your report parameter selections, plots one of the following average participation metrics:
|
|
Line Points |
Line points representing a participation metric you selected will be plotted for the specific time period requested when you ran the report. Use the line chart to see the trend of the participation metric. |
Drill through report options
When your role has the privilege to view Management reports, you can drill through the Performance bar to other reports and see additional information.
|
Employee Selection Report Parameter |
Available Drill Through Report |
|---|---|
|
Organization |
Participation by Organization report |
|
Employee Filter |
Participation by Employee report |
|
Run Report for Self |
(not available) |
Participation by Organization report