Participation by Employee report
Use Participation by Employee report to generate a bar chart that illustrates the effectiveness of your surveys at the employee level.
Any participation report indicates the health of your Voice of the Customer practice, not the results provided by customers. You can see if customers are participating in surveys and the extent of that participation.
Participation reports enable you to use response rates to identify
-
the level of customer participation in surveys
-
the completion rate when customers start a survey
-
if the customer experience (the timing and language of the offer to share feedback) is conducive to participation, and
-
if the survey design is effective in terms of asking the right questions and the branching logic used (if any).
For example, a low completion rate could indicate that a survey is poorly structured or not relevant to the caller’s experience. A low participation rate may indicate that the way you bring customers into a survey are not effective.
In addition to performance values reported as a percentage, you will also see the volume of data collected. The volume of data suggests the significance of the percentages reported.
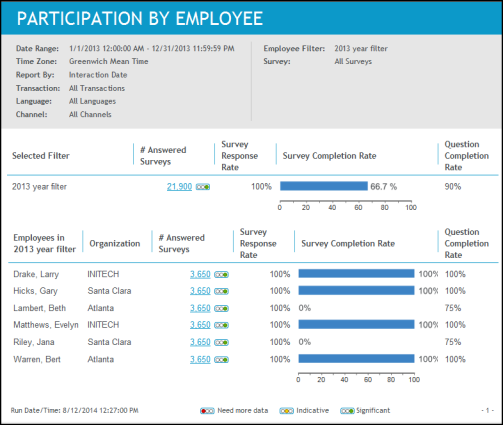
The report provides two levels of employee participation information.
-
Selected Filter: The first section provides a summary of participation data for all employees included in the selected employee filter.
-
Employeesin the Selected Filter: The second section provides individual participation data for each employee included in the selected employee filter.
If an employee belonged to more than one organization for the report date range, the data will be listed for each organization.
Example: If an employee belongs to two organizations (Org A & Org B), this section of the report will include two rows of information for the employee (one row for Org A and one row for Org B).
Report output
The Participation by Employee report contains the following data relative to the selected report parameters:
|
Data |
Description |
|---|---|
|
First section: Selected Filter Second section: Employees in Selected Filter |
The report contains data for the following two levels of employee data:
|
|
# Answered Surveys |
Number of surveys with at least one answer or recorded message. |
|
Survey Response Rate |
Percentage of issued surveys that result in at least one answered question or a survey close comment. |
|
Survey Completion Rate |
Bar chart representing the survey completion rate. The percentage of answered surveys (surveys with at least one answered question or a survey close comment) that are completed in their entirety. |
|
Question Completion Rate |
Percentage of questions answered on surveys with at least one answer or a survey close comment. |
Drill through report options
You can drill through to other reports and see additional information.
|
Report Section |
Report Link |
Drill Through Report |
|---|---|---|
|
Selected Filter |
Number of answered surveys |
Participation by Survey report |
|
Survey completion rate (bar chart) |
Participation Trend report |
|
|
Employees in Default Filter |
Number of answered surveys |
Participation by Survey report |
|
Survey completion rate (bar chart) |
Participation Trend report |