Participation by Survey report
Use Participation by Survey report to gauge customer participation at both the survey level and question level via bar charts. Any participation report indicates the health of your Voice of the Customer practice, not the results provided by customers. You will be able to see if customers are participating in surveys and the extent of that participation.
Participation reports enable you to use response rates to identify:
-
The level of customer participation in surveys
-
The completion rate when customers start a survey
-
If the customer experience (the timing and language of the offer to share feedback) is conducive to participation
-
If the survey design is effective in terms of asking the right questions and the branching logic used (if any)
For example, a low survey completion rate could indicate that a survey is poorly structured or not relevant to the caller’s experience. A low survey response rate may indicate that the way you bring customers into a survey is not effective. The answered question count compared to the question response rate for all questions in a survey flow shows where survey participation dropped off.
In addition to performance values reported as a percentage, you will also see the volume of data collected. The volume of data suggests the significance of the percentages reported.
Page 1 - Report output
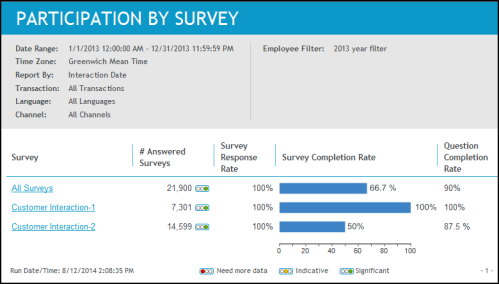
Page one of the Participation by Survey report contains the following data relative to the selected report parameters:
|
Data |
Description |
|---|---|
|
Survey |
Name of the survey. The initial entry of the report aggregates data for all surveys for the organization or employee. ToolTip: Survey introduction text. If no introduction exists, then “Script not defined” displays. |
|
# Answered Surveys |
Number of responses provided for the survey. |
|
Survey Response Rate |
Percentage of issued surveys that result in at least one answered question or a survey close comment. |
|
Survey Completion Rate |
Bar chart representing the survey completion rate. Percentage of answered surveys (surveys with at least one answered question or a survey close comment) that are completed in their entirety. |
|
Question Completion Rate |
Percentage of questions answered on surveys with at least one answer or a survey close comment. |
Page 1 - Drill through report options
You can drill through to other reports and see additional information.
|
Report Link |
Drill Through Report |
|---|---|
|
Survey name |
|
|
Survey completion rate (bar chart) |
The time period for the drill-through trend report defaults to 14 days, 13 weeks, or 12 months, based on the periodicity selected when running the initial report. |
Page 2 thought n - report output
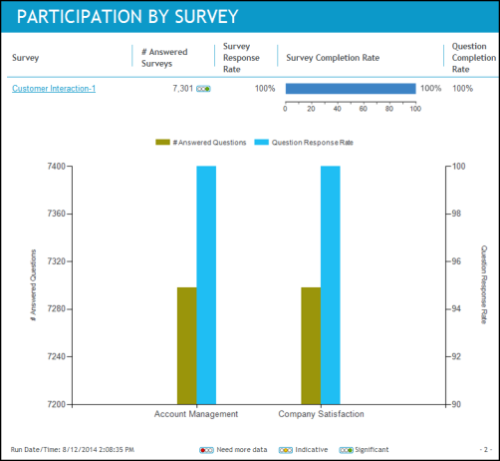
With the exception of the All Surveys row, a page is added to the report for each survey row that has one or more responses. For each question in the survey, the additional page displays a bar chart that compares the number of answered question to the question response rate. The question bar charts are listed from left to right in the order the questions were presented in the survey/survey structure page.
The additional pages on the Participation by Survey report contains the following data relative to the selected report parameters:
|
Data |
Description |
|---|---|
|
Top section: For the survey, this data is repeated from the first page. |
|
|
Bar chart section: |
|
|
# Answered Questions |
Number of times the question was answered. |
|
Question Response Rate (right Y-axis) |
Percentage of times a question was answered on surveys with at least one answer or a survey close comment. |
|
Bars in bar chart |
Left bar represents the number of answered questions. Right bar represent the question response rate. |