Response Trend report
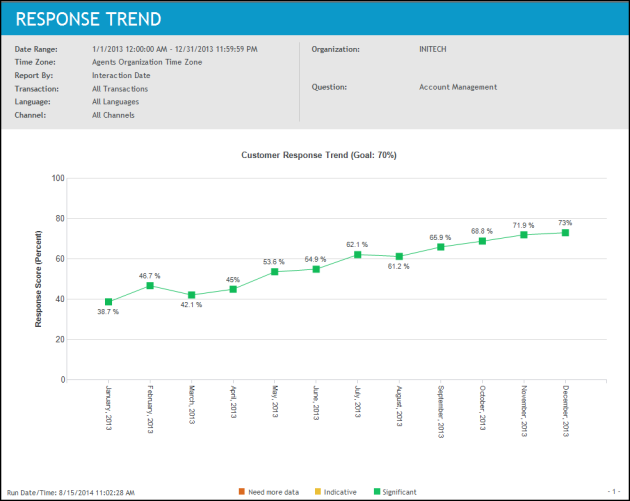
The Response Trend report provides a line chart that illustrates response metrics for an organization (including its suborganizations) or an employee over a given period of time. You select both the time frame and the response metric for trending.
In addition to performance values reported as a percentage, you will also see an indicator of the volume of the data collected. The volume of the data suggests the significance of the trend.
Report output/data
This report contains the following data relative to the selected report parameters:
|
Data |
Description |
|---|---|
|
X-axis |
Plots the specific time frame (days, weeks, or months) you have selected in the report parameters. |
|
Y-axis |
Data depends on whether you selected Business Objective or Question in the report parameters.
The Y-axis is scaled to a percentage-basis. |
|
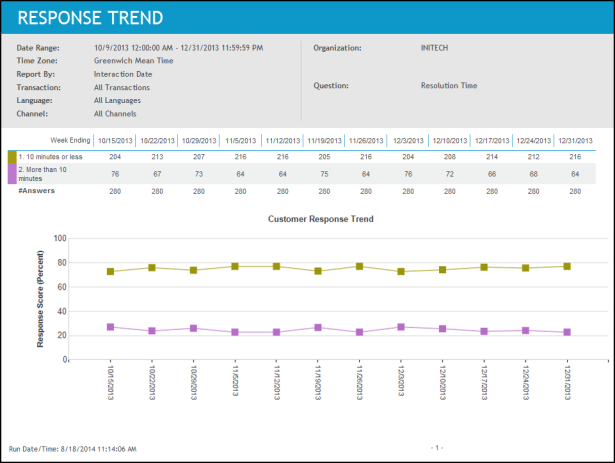
table of answer distribution |
This table is only displayed when you select Question in the report parameters and choose either an Option question or a Comment Question.
|
|
Line Points |
|
Drill through report options
When your role has the privilege to view Management reports, you can drill through the Performance bar to other reports and see additional information.
|
Employee Selection Report Parameter |
Available Drill Through Report |
|---|---|
|
Organization |
Response by Organization report |
|
Employee Filter |
Response by Employee report |
|
Run Report for Self |
(not available) |
Sample report - business objective(s) and scale Question trend
Sample report - option question trend
Sample report - comment question trend
