Response by Employee report
Use the Response by Employee report to compare the number of survey responses obtained by employees to understand employee performance (for example, you can compare the responses obtained by employees in the same or different organizations).
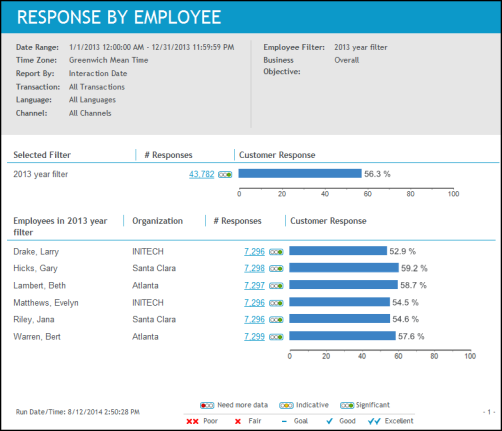
In addition to performance values illustrated by a bar chart and reported as a percentage, you will also see the volume of data collected. The volume of data indicates the significance of the percentages reported.
This report contains data for two levels of employee performance:
-
Selected Filter: In this summary section, responses are reported for the employees in the selected filter. When the filter includes employees in one organization and default goals are set, a goal indicator is displayed at the end of the score scale.
-
Employees in the Selected Filter: In this detailed section, responses are reported for each employee in the selected filter.
If an employee belonged to more than one organization for the report date range, the data will be listed for each organization.
Example: If an employee belongs to two organizations (Org A & Org B), this section of the report will include two rows of information for the employee (one row for Org A and one row for Org B).
Report output/data
This report contains the following data relative to the selected report parameters:
|
Data |
Description |
|---|---|
|
Sections: Selected Filter and Employees in Selected Filter |
This report contains data for two levels of employee performance:
|
|
# Responses |
The data varies based on the section of the report you are viewing, whether you selected the Business Objective or Question parameter, and the types of questions:
|
|
Customer Response |
The meaning of the bar graph varies based on the section of the report you are viewing, whether you selected the Business Objective or Question parameter, and the types of questions:
|
Drill through report options
You can drill through to other reports and see additional information.
|
Report Section |
Report Link |
Drill Through Report |
|---|---|---|
|
Selected Filter
|
Number of responses |
Response By Question report |
|
Customer response (bar chart) |
Response Trend report |
|
|
Employees in the Default Filter |
Number of responses |
Response By Question report |
|
Customer response (bar chart) |
Response Trend report |