Response by Organization report
Use the Response by Organization report to compare business areas with similar function (ranking, performance) or dissimilar business areas (to understand business strengths.)
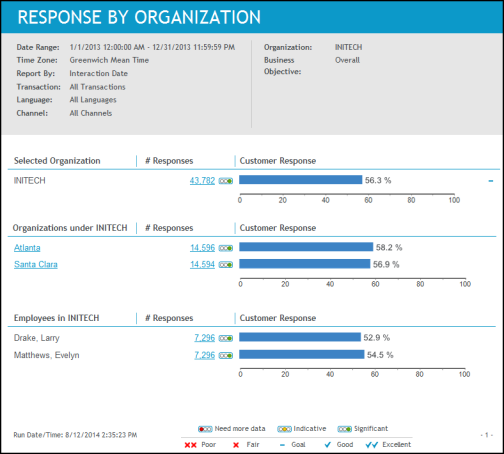
In addition to performance values illustrated by a bar chart and reported as a percentage, you will also see the volume of data collected. The volume of data indicates the significance of the percentages reported.
This report contains data for the following organizational units:
-
Selected Organization: In this summary section, responses are reported for the organization that you have selected. When default goals are set, a goal indicator is displayed at the end of the score scale.
-
Organization under the Selected Organization: In this detailed section, responses are reported for each direct suborganization for the selected organization. The report does not include all the descendant organizations.
-
Employees in the Selected Organization: In this detailed section, responses are reported for each employee in the selected organization. Employees in suborganizations are not included.
Report output/data
This report contains the following data relative to the selected report parameters:
|
Data |
Description |
|---|---|
|
Section: Organization, Suborganization, or Employees |
This report contains data for the following organizational units:
|
|
# Responses |
The data varies based on the section of the report you are viewing, whether you selected the Business Objective or Question parameter, and the types of questions:
An icon indicates whether the volume of data is sufficient. |
|
Customer Response |
The meaning of the bar graph varies based on the section of the report you are viewing, whether you selected the Business Objective or Question parameter, and the types of questions:
Scale and option questions: When goals have been configured, a goal indicator is displayed. |
Drill through report options
You can drill through to other reports and see additional information.
|
Report Section |
Report Link |
Drill Through Report |
|---|---|---|
|
Selected Organization
|
Number of responses |
Response By Question report |
|
Customer response (bar chart) |
Response Trend report |
|
|
Organizations Under the Selected Organization |
Organization name |
Response by Organization report (This report will be run for the selected organization.) |
|
Number of responses |
Response By Question report |
|
|
Customer response (bar chart) |
Response Trend report |
|
|
Employees in the Selected Organization |
Number of responses |
Response By Question report |
|
Customer response (bar chart) |
Response Trend report |