Select results for the Recording Policy Trend chart
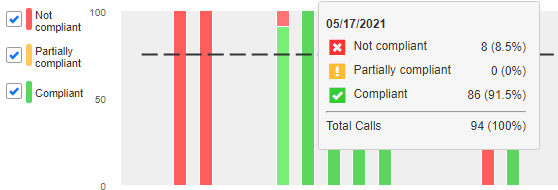
The Recording Policy Trend chart shows a graphical view of results for an organization over a time frame. The Not compliant, Partially compliant, and Compliant check boxes control the categories of results shown on the chart.
Including all results on the chart can help to identify trends relative to the Capture Verification Service Level Indicator (SLI) target for recording policy. A dashed line represents the SLI target, visible when all three check boxes are selected.
Before you begin
View the Capture Verification Overview dashboard
Procedure
-
Under Recording Policy Trend, select one or more options: Not compliant, Partially compliant, Compliant.
-
To view a detailed summary showing percentage and actual values for a time period, move the cursor across the chart to an area of activity.
The summary shows the total number of call or recording segments processed by Capture Verification for the selected categories, and the proportion in each category.