Recording Policy Trend chart
The Recording Policy Trend chart shows Capture Verification results for recording policy. The chart is a 100% stacked-column chart, with each column representing 100% of calls in the categories selected, over the time period shown on the X axis.
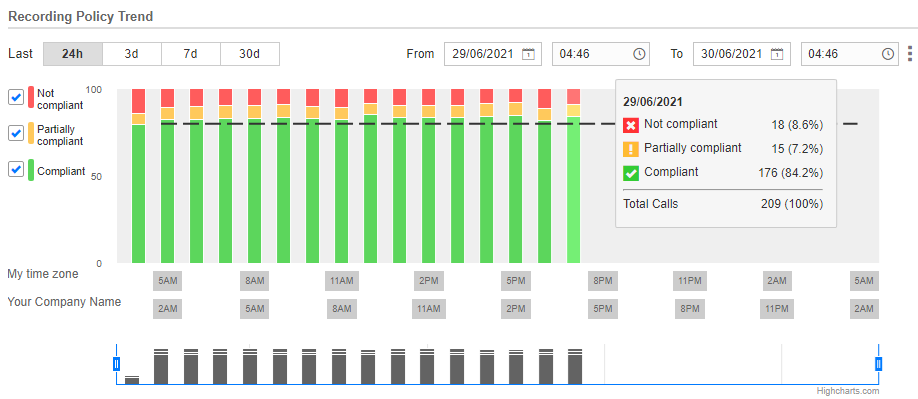
Recording Policy Trend chart date and time options change the date and time shown on the chart.
Compliance options change the results shown on the Recording Policy Trend chart. Each column on the chart represents 100% of calls in the selected categories, over the time period shown on the X axis.
The chart navigator focuses the Recording Policy Trend chart on part of the time line. The focus zooms the chart view so that you can pinpoint times for Not compliant, Partially compliant, and Compliant results.
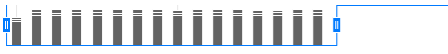
The navigator also provides a graphical representation of call volumes over the chart time frame. Each column represents the total number of calls for the compliance options selected, and each segment represents the total number of calls in a category.
The Recording Policy Trend X axis shows dates and times in My time zone, the time zone defined in the system under user Preferences, on the General Preference Settings tab.
By adding an organization time zone, you can view the corresponding dates and times in an organization's time zone, making it easier to interpret results and trends for the organization.
Change the Recording Policy Trend time frame
Select results for the Recording Policy Trend chart
View a detailed section of the Recording Policy Trend chart
Add or remove a Recording Policy Trend organization time zone
General Preference Settings (Getting Started)