KPI by Response Matrix report
Use this report to understand how the Voice of the Customer relates to other metrics collected in your performance management practice.
For example, you could run the report to correlate customer satisfaction with process (a Customer Feedback business objective) to a KPI for call handling time. The correlation enables you to assess how call handling time impacts customer perception of the company’s process.
Another example is that you could correlate a business objective measuring overall customer satisfaction to evaluation scores from the Quality Monitoring system (if you have Quality Monitoring integration). The correlation enables you to assess how agent performance impacts overall customer satisfaction.
The KPI by Response Matrix report generates a scatter chart. The scatter chart’s matrix view can be organization-based or employee-based.
-
For an organization-based matrix, the points plotted represent direct suborganizations only.
-
For an employee-based matrix, the points plotted represent all employees for all organizations subordinate to the selected organization.
-
If you have defined an organizational goal for the KPI in scorecards, it is displayed at the bottom of the report.
-
If you selected a specific business objective that has a feedback goal defined, it is displayed above the matrix chart.
-
If a KPI value is above or below the upper and lower limits defined in the Scorecards module for the KPI, the value is not displayed on the report.
Requirements to generate and view this report
This report is only available to users when
-
Scorecards is licensed and installed on the suite, and
-
the user’s system role has the required privileges.
Required privileges by product:
-
Customer Feedback: Reports - Management
-
Scorecards: Explore Scorecards
Parameters
This report uses several unique parameters in addition to the common report parameters.
This report also uses the following unique parameters:
|
Parameter |
Description |
|---|---|
|
KPI Type |
Specifies the type of KPI to use in the report. The options depend on the Matrix view parameter. For Organization, the options are:
For Employee, the option is:
|
|
Periodicity |
Specifies the interval to report for the KPI. The value displayed is based on the Time Frame parameter.
|
|
KPI |
Specifies the KPI to use. The list includes all KPIs from Scorecards which have been imported and configured for Customer Feedback. |
Report output/data
The KPI by Response Matrix report contains the following data relative to the selected report parameters:
|
Data |
Description |
|---|---|
|
X-axis |
Plots the KPI you have selected in the report parameters. Depending on the KPI, the X-axis may be scaled to a percentage-basis. |
|
Y-axis |
Depending on your report parameter selections, plots one of the following average scores:
The Y-axis is scaled to a percentage-basis. |
|
Scatter Points |
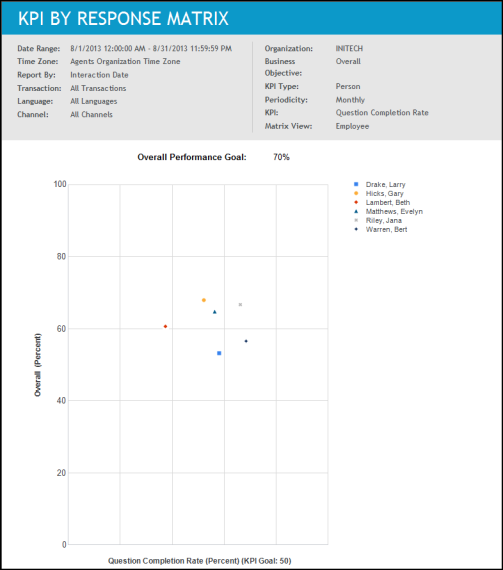
Data points will be displayed relative to the X- and Y-axes and represent either direct suborganizations or employee direct and indirect reports, depending on how you selected your parameters when running the report. A point’s location on the matrix corresponds directly to its values on the X- and Y-axes. NOTE: If a suborganization or employee does not have a KPI value or survey data for the selected organization and date, it will not be plotted on the chart. Point to a data point to see detailed information about it including:
|
Drill through report options
When your role has the privilege to view Management reports, you can drill through to other reports and see additional information.
|
Report Link |
Drill Through Report |
|---|---|
|
scatter points |
|
Sample report
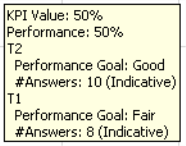
When data points occupy the same position on the matrix
If entities occupy the same X/Y position on the matrix, the ToolTip provided when you mouse over the data point will include each entity. The ToolTip text will display the entities in descending order by volume of data.
If drill through functionality is provided, the entity with the highest volume of data will be reported.