Question Balance by Organization report
Use the Question Balance by Organization report report to calculate a performance index for survey responses that focuses on the most relevant customer experiences. The performance index captures the difference between customers reporting highly positive experiences, and customers reporting highly negative experiences.
The report ignores responses in the middle of the scale because the highly positive and highly negative experiences are likely to be most relevant and actionable for the organization. In addition, the question balance report is more sensitive to changes in the business that are truly impacting the customer experience.
The performance index, referred to as the question balance, is calculated as:
(Percentage of answers >= Excellent Goal) - (Percentage of answers <= Poor Goal)
If all answers for the reported organizational unit fall into the Fair, Goal, or Good goal categories, the question balance is 0%. Likewise, if the percentage of answers for the Excellent goal category equals the percentage of answers for the Poor goal category, the question balance is also 0%.
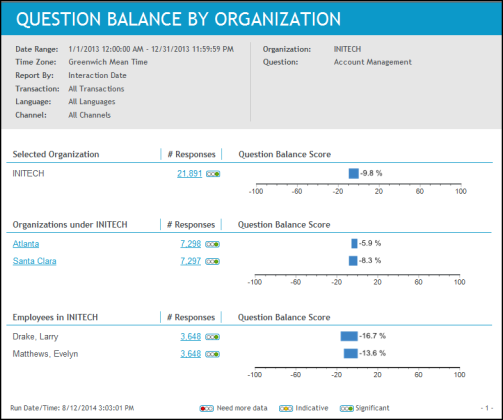
The report generates a bar chart illustrating the question balance for a specific question. Performance is based on feedback goals. Therefore, to generate a report for a question, the question must have feedback goals defined for it at the selected organizational level; if no feedback goals have been defined for the question at the selected organizational level then the report output will state that no data are available for the selected question.
In addition to the calculated question balance reported as a percentage, you will also see the volume of data collected. The volume of data suggests the significance of the percentages reported.
The report calculates the question balance for the following organizational units:
-
Selected Organization: Question balance is calculated for the organization you have selected for the report. The calculation includes all employees for the selected organization and all employees for any subordinate organizations.
-
Organizations Under the Selected Organization: Question balance is reported for each direct, suborganization for the selected organization. The report does not include all descendant organizations, but only the direct suborganizations.
-
Employeesin the Selected Organization: Participation is reported for each employee belonging to the selected organization. Employees belonging to suborganizations are not included.
Report output/data
The Question Balance by Organization report contains the following data relative to the selected report parameters:
|
Data |
Description |
|---|---|
|
Section: Organization, Suborganization, or Employees |
The report contains data for the following organizational units:
|
|
# Responses |
Total number of responses used to calculate the question balance. |
|
Question Balance Score |
Bar chart representing the calculated question balance value for the organizational unit.
|
Drill through report options
You can drill through to other reports and see additional information.
|
Report Section |
Report Link |
Drill Through Report |
|---|---|---|
|
Selected Organization |
Number of responses |
Response By Question report |
|
Question balance score (bar chart) |
Answer Distribution report |
|
|
Organizations Under the Selected Organization |
Organization name |
Question Balance by Organization report (This report will be run for the selected organization.) |
|
Number of responses |
Response By Question report |
|
|
Question balance score (bar chart) |
Answer Distribution report |
|
|
Employees in the Selected Organization |
Number of responses |
Response By Question report |
|
Question balance score (bar chart) |
Answer Distribution report |