Top Box by Organization report
Use the Top Box by Organization report to generate a bar chart that identifies top-tier performance (highest customer rating) for all business objectives, a specific business objective, or a specific question.
Top box performance focuses on the top scores received, rather than aggregate scores. Use of top box performance provides you with a measure that is more responsive to cases where an organization is not executing at the highest level.
Top box performance is reported as a percentage or ratio, which is calculated as:
(Number of responses with highest score) / (Total number of responses)
No goals are associated with the top box rating. The highest score is identified as the highest possible score-based response a customer has the opportunity to select. Option-based questions are not reflected in top box reports.
The report calculates the top box score for the following organizational units:
-
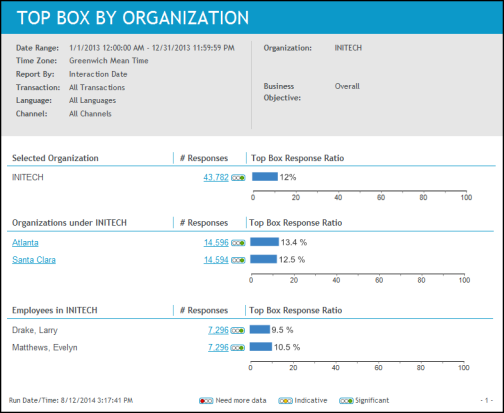
Selected Organization: Top box is calculated for the organization you have selected for the report. The calculation includes all employees for the selected organization and all employees for any subordinate organizations.
-
Organizations Under the Selected Organization: Top box is reported for each direct, suborganization of the selected organization. The report does not include all descendant organizations, but only the direct suborganizations.
-
Employeesin the Selected Organization: Top box is reported for each employee belonging to the selected organization. Employees belonging to suborganizations are not included.
Report output/data
The Top Box by Organization report contains the following data relative to the selected report parameters:
|
Data |
Description |
|---|---|
|
Section: Organization, Suborganization, or Employees |
The report contains data for the following organizational units:
|
|
# Responses |
Total number of responses used to calculate the top box percentage. |
|
Top Box Response Ratio |
Bar chart representing the calculated top box ratio for the organizational unit.
|
Drill through report options
You can drill through to other reports and see additional information.
|
Report Section |
Report Link |
Drill Through Report |
|---|---|---|
|
Selected Organization |
Number of responses |
Response By Question report |
|
Top Box ratio response (bar chart) |
Top Box Trend report |
|
|
Organizations Under the Selected Organization |
Organization name |
Top Box by Organization report (This report will be run for the selected organization.) |
|
Number of responses |
Response By Question report |
|
|
Top Box ratio response (bar chart) |
Top Box Trend report |
|
|
Employees in the Selected Organization |
Number of responses |
Response By Question report |
|
Top Box ratio response (bar chart) |
Top Box Trend report |