Capture Verification Incidents Trend Graph
The Incidents Trend Graph provides a graphical representation of the number of issues Automated Verification detects. The chart is a line graph, with each trend line representing a type of issue detected for the call or recording segments matching the filters set, over the time period shown on the X axis.
While the list view of the Incidents workspace shows the metadata associated with call or recording segments with issues and provides details about the participants and the call and recording scenario, the Incidents Trend Graph helps identify trends and spot unusual patterns in the occurrence of issues.
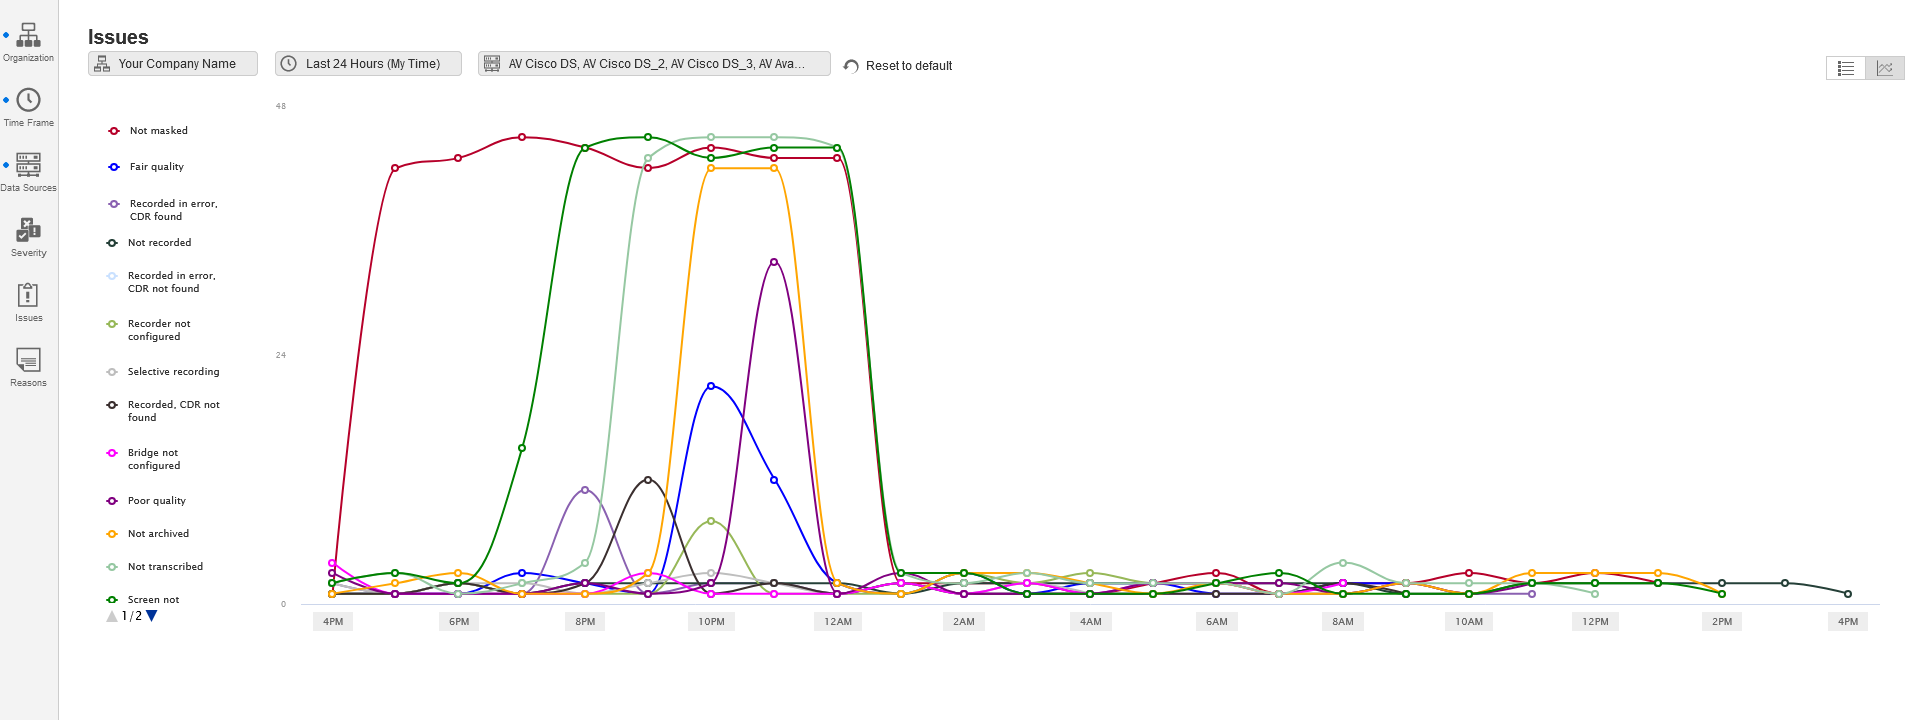
Each colored trend line in the graph represents an issue type detected for call or recording segments matching a filter.
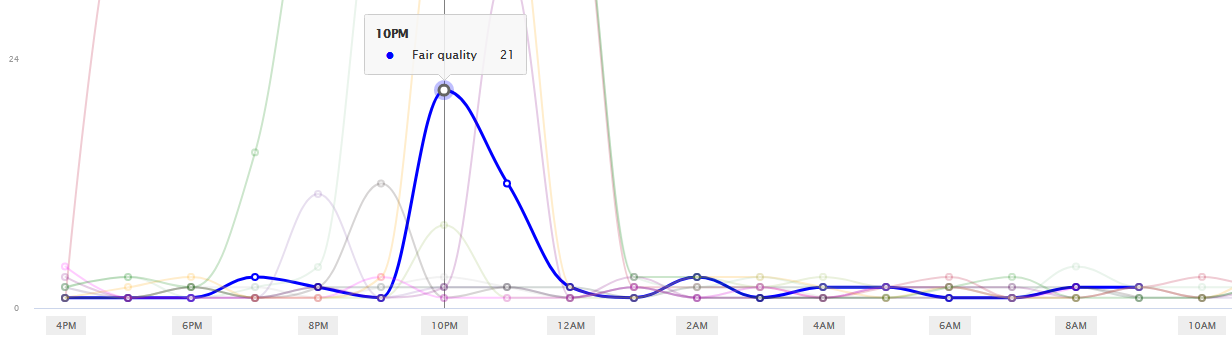
The legend and the trend lines are not selectable. Pointing at a legend entry highlights the legend entry and the related trend line. Pointing at a trend line displays a tooltip with the number of call or recording segments with that type of issue on a specific time or date.
 or down
  buttons, to view a different page of the legend.
The Incidents Trend Graph X axis shows dates and times in My time zone, the time zone defined in the system under user Preferences, on the General Preference Settings tab. The data is shown grouped by the start time of the call or recording segments, rounded down to the nearest hour or day.
The X axis aligns to the available issue data. This means that if the beginning or the end of a specified time frame does not have any data, the graph does not show those times or dates on the axis.
Filters applied on the list view of the Incidents workspace are also applied to the Incidents Trend Graph.
Capture Verification Incidents overview
Types of issues Capture Verification detects
Filtering results on Capture Verification Incidents
View the Capture Verification Incidents Trend Graph
General Preference Settings (Getting Started)