Feedback Overview report
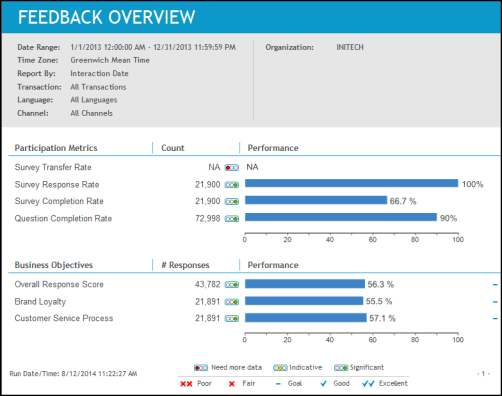
Use the Feedback Overview report for a high level summary of customer participation in your Voice of the Customer practice and for a summary of responses by business objective.
You can use the overview data, reported as a bar chart, to:
-
Analyze the health of your Voice of the Customer practice to determine how well your surveys are functioning.
-
Gauge a company, organization or employee against defined business objectives.
In addition to performance values reported as a percentage, you will also see the volume of data collected. The volume of data suggests the significance of the percentages reported.
Report output
The Feedback Overview report contains the following data relative to the selected report parameters:
|
Data |
Description |
|---|---|
|
Participation Metrics |
Provide data you can use to analyze the effectiveness of your surveys. Participation metrics indicate how many customers are starting your surveys, completing your surveys, leaving your surveys before completion, and so on. |
|
Count |
Total count of the participation metric. For all participation metrics formulas, the count is the denominator. Example: The formula for the Survey Response Rate is Answered Surveys/Issued Surveys. The count is Issued Surveys. |
|
Performance |
Bar chart representing the average score percentage for all scale questions associated with the business objective. |
|
|
|
|
Business Objectives |
Lists the average for business objectives applicable to the selected organization or employees.
|
|
# Responses |
Number of questions answered for the business objective. |
|
Performance |
Bar chart representing the average score percentage for all scale questions associated with the business objective. |
|
Goals |
Displays performance relative to the feedback goals established for the business objective. If no goals have been defined for a business objective, they will not display on the report. |
Drill through report options
When your role has the privilege to view Management reports, you can drill through the Performance bar to other reports and see additional information.
|
Employee Selection Report Parameter |
Report Link |
Available Drill Through Report |
|---|---|---|
|
Organization |
Participation Metrics bar chart |
Participation by Organization report |
|
Business Objectives bar chart |
Response by Organization |
|
|
Employee Filter |
Participation Metrics bar chart |
Participation by Employee report |
|
Business Objectives barchart |
Response by Employee report |
|
|
Run Report for Self |
— |
(not available) |
Counts and number of responses on reports
Participation by Organization report
Response by Organization report